Civic Data Analytics Platform: How Mendo Tracks Local Economic Growth
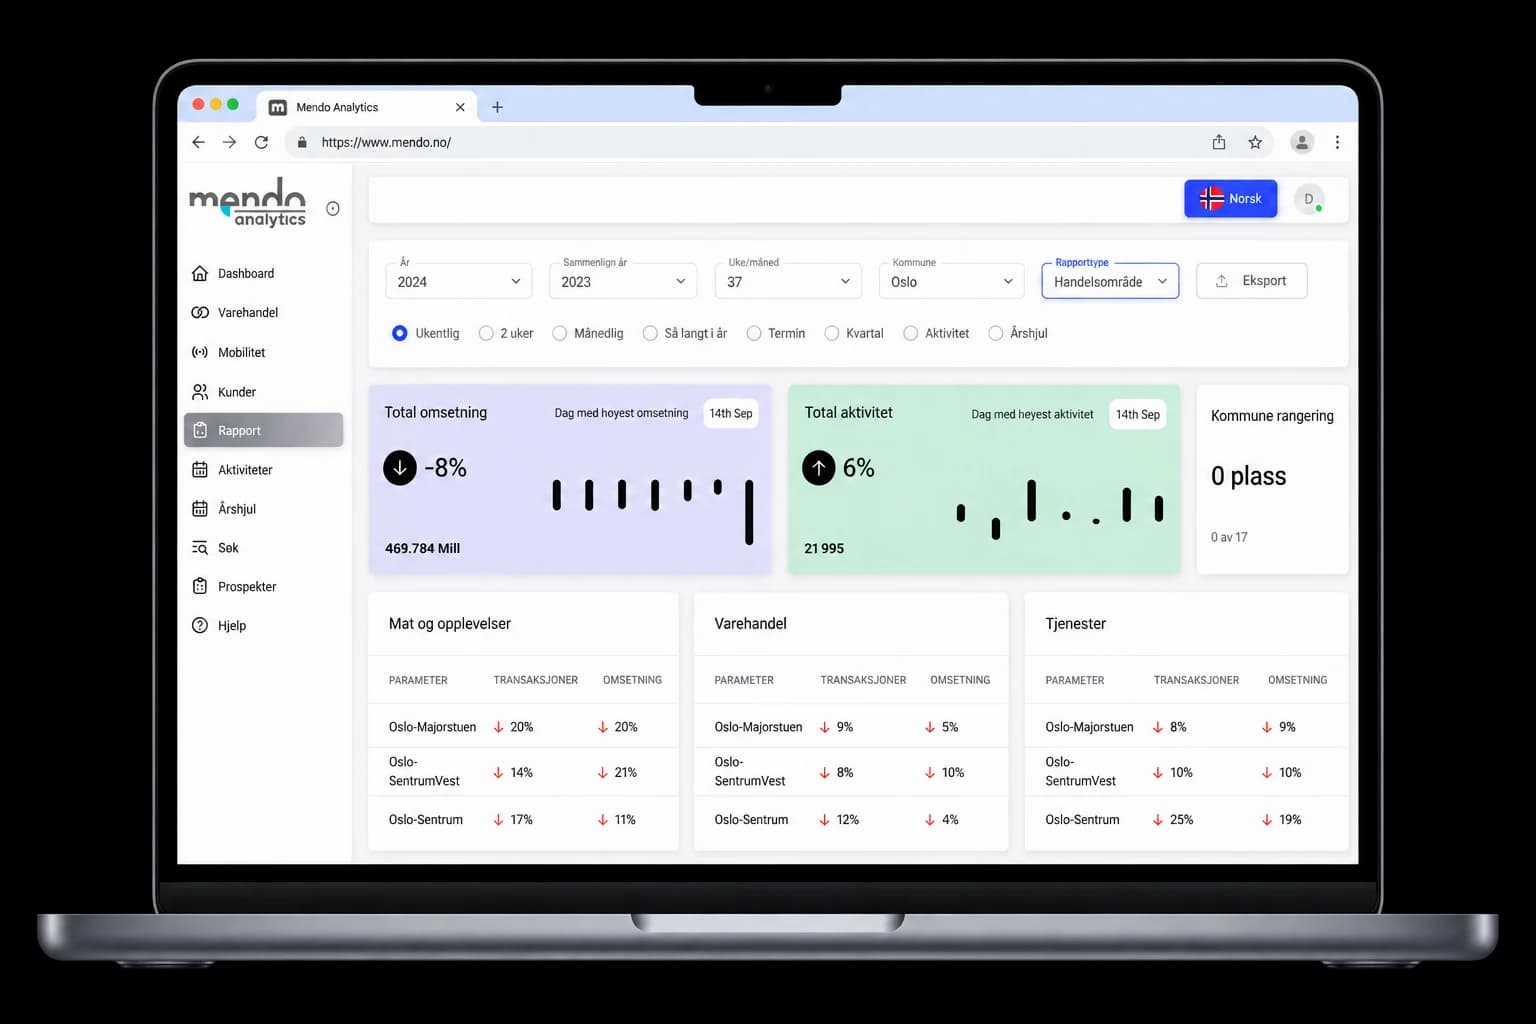
Mendo needed one place where municipalities, county councils, and city-center associations could see footfall, turnover, and sector performance without waiting on a spreadsheet from three different departments. Divtechnosoft built that platform from the ground up , the data pipeline, the dashboards, and the comparison tools that now support over 20 Norwegian municipalities.
About Mendo
Mendo is a Norwegian data analytics company that gives county councils, municipalities, city-center associations, and individual retailers a live read on how their local economy is performing.
Founded in 2019, the company set out to replace static, backward-looking reports with a platform that tracks footfall, turnover, and sector-by-sector growth as it happens , then lets one municipality see how it compares with another.

The Challenge
Municipal economic development teams and city-center associations had no single source of truth for how local trade was performing. Footfall counts came from one provider, turnover figures from another, and each dataset arrived on its own schedule and in its own format.
Before Mendo, a typical client juggled up to 5 separate data sources, spending nearly a week compiling a single monthly report manually.
The Challenges We Solved
Data Integration Complexity
Real-Time Visualization
Regional Comparisons
Data Accuracy & Reliability
Our Development Roadmap
A four-phase build, from data modeling to production deployment, completed over 16 weeks.
Data Analysis & Planning
Mapped every data source Mendo needed to pull from, defined the data models that would sit under the dashboards, and planned how disparate feeds would be normalized into one schema.
Backend & Data Pipeline
Built the Laravel backend and the automated data-fetching pipeline, with MySQL handling storage for the growing volume of processed records, plus validation logic to catch bad imports before they reached a dashboard.
Frontend & Visualizations
Built the Vue.js frontend, including the interactive charts, filters, and the region-to-region comparison tool that became the platform's core feature.
Infrastructure & Deployment
Set up CI/CD pipelines and monitoring, then deployed to production infrastructure built to hold up under government-grade uptime expectations.
Our Solution
Divtechnosoft designed, built, and deployed Mendo's entire analytics platform from a blank slate , architecture, backend, frontend, admin tooling, and the visualizations that sit on top of all of it.
The brief wasn't just to build a dashboard. It was to give non-technical municipal staff a tool that could stand in for a full-time data analyst , pulling numbers automatically, catching errors before they reached a chart, and making comparisons between regions that would otherwise take a spreadsheet and a free afternoon.
Automated Data Pipeline
Built the fetching and processing pipeline that pulls footfall, turnover, and sector data from third-party providers on a schedule, with error-handling so a bad export from one source doesn't quietly skew a month's figures.
Interactive Visualizations
Built charts, graphs, and maps that respond to filters in real time , by sector, by time period, or by area , so a user can go from a top-level trend to the specific district driving it in a couple of clicks.
Regional Comparison Tools
Built the benchmarking feature that lets a municipality set its own performance against a neighboring county or a comparable city center , the feature Mendo's own customers point to most often as the reason they use the platform.
Admin Dashboard
Built the internal tools Mendo's own team uses to manage data sources, add new municipalities, configure user roles, and keep the whole system running without needing a developer for routine changes.
Key Features
Eight features carry the platform end to end, from the moment data lands to the moment a municipal officer pulls a report for a council meeting.
Automated Data Fetching
Scheduled imports run on a set cadence with validation and error-handling built in, so a malformed export gets flagged instead of silently entering a dashboard.
Data Aggregation & Processing
Normalizes datasets that arrive in different formats and on different schedules into one consistent structure, then enriches them so they're ready for the visualizations on top.
Interactive Data Visualizations
Charts, graphs, and maps that update as a user filters by sector, time period, or area , built to be read by a city-center manager, not just a data analyst.
Region-to-Region Comparisons
Side-by-side benchmarking between municipalities of different sizes , including comparing a city center against its surrounding district, one of the ways Mendo's customers use the tool most.
Custom Report Generation
Export a report scoped to specific metrics and a specific time window , the same kind of export some city-center associations pull weekly to share with their members.
Role-Based Access Control
Granular permissions keep each municipality's users inside their own data , a county-level user sees the region, a city-center association sees only its own area.
Platform Configuration & Management
The same tools Mendo's team uses internally , managing data sources, adding new municipalities, and adjusting configuration , without needing a developer for routine changes.
Multi-Municipality Support
Built to scale past the current 20+ municipalities without a redesign , each one gets an isolated data view on the same underlying architecture.
Results & Impact
The numbers at the top of this page aren't just a headline , here's what changed for the municipalities using Mendo day to day.
Faster, More Frequent Reporting
Monthly reports that used to take a week to compile now take under 24 hours, as the automated pipeline instantly pulls and normalizes the data.
Wider Adoption Across Regions
The platform now supports 20+ municipalities, up from 3 at launch, each one added without a rebuild on the multi-tenant architecture built during the original engagement.
Reliable Enough for Government Decision-Making
At 99.9% uptime, the platform has held up as a data source municipalities can cite in council meetings and budget discussions , the reliability bar government clients set going in.
A Platform That Scales With the Data
Since launch, the platform has scaled to process over 4.2 million data points monthly, seamlessly integrating 12 new municipal data sources.
"Divtechnosoft didn't just build a dashboard; they fundamentally changed how our municipalities operate. The region-to-region comparison tool alone saves our clients days of manual spreadsheet work every month."
What We Learned
Four things that shaped how we'd approach a data-heavy civic platform again.
Data Quality is Paramount
A dashboard is only as trustworthy as the pipeline behind it , validation and error-handling in the data layer mattered more to user trust than any chart-design decision.
Visualization Drives Adoption
Municipal staff didn't open Mendo more often because the underlying data got better , they opened it more because comparisons finally took two clicks instead of a spreadsheet.
Performance at Scale
Query and caching decisions that were fine at a handful of municipalities started to matter once the dataset crossed into millions of rows , optimizing earlier would have saved a later rework.
Reliability is Non-Negotiable
Government and municipal clients don't treat downtime the way a typical SaaS customer might , if the platform is down during a council meeting, that's a credibility problem for Mendo, not just an inconvenience.
Technologies Used
Robust tech stack for data-intensive civic analytics.
Laravel
Vue.js
MySQL
Common Questions
Questions About This Build
Explore Related Case Studies
Discover how we help other businesses achieve success through digital transformation.





Ready to Create Your Next Success Story?
Tell us what you're trying to build, and we'll tell you honestly whether it's a fit , the same way we scoped Mendo's platform before writing a line of code.